How to think about PCG in Unreal Engine 5
One of the aims for the game I’m writing is that it’s set in the here and now- or at least, the here soon-to-be-now. I find it odd that in contrast to other media, there’s not a lot of games that go down that route.
Call of Duty sets itself in the ‘now’ but rarely in the ‘here’, except when it’s trying to shock people; FIFA is very much in the here and now, but it’s football, and the gaming equivalent of Now That’s What I Call Music. Beyond those, and the occasional spin on A Connecticut Yankee In The Court of King Arthur But With More Wizards and a Skill Tree, it’s nearly all spaceships and dungeons and “cosy” farming and floating islands and furry-adjacent nerd bait and so on.
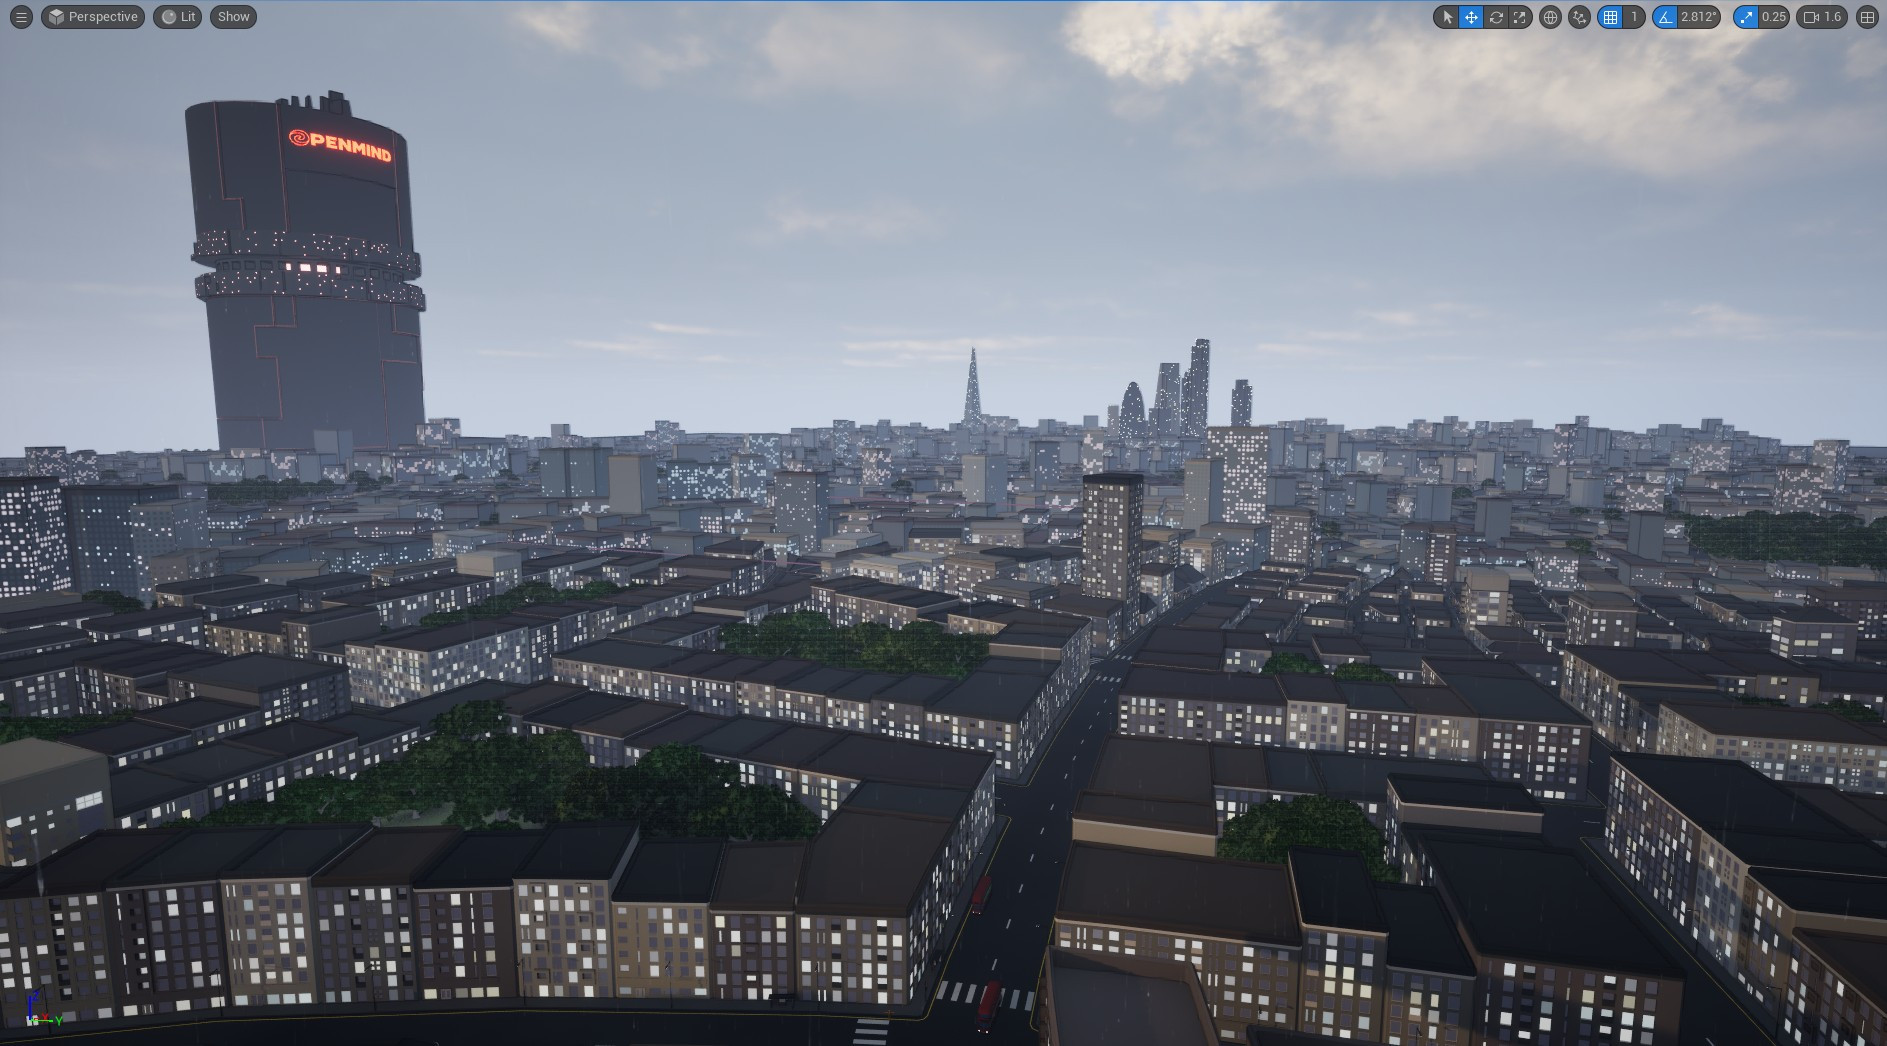
Thing is, I live in London, meaning that if I want a game that is ‘here and now’, I’ve got to build something that looks like London. So, I’ve been working out how to do that, and the main tool I’ve been using is Unreal Engine 5’s PCG framework.
This is the first of a series of posts I intend to write about how I approached the problem of building a city without spending six years in Blender, and the things I found out (and friends I made!) along the way. Future posts are going into some of the detail of the approach, what worked, and what didn’t; and in particular the amazing plugin PCGEx that made a lot of it possible.
What this post isn’t, and what it is
This post isn’t intended as a tutorial- there’s lots of those, and they’re mostly great. They’ll show you how to do things.
But the ones I’ve seen don’t really explain the what or why of the system, and I find that to be just as important as finding out where all the buttons are. A lot of stuff in the PCG framework isn’t obvious, and I had some pretty confusing moments before I finally got the architecture straight in my head.
The aim of this post is really to save others that confusion, and hopefully get them up to speed quicker.
I’m going to assume you know how to enable the plugin, how to create PCG graph, and how to create a PCG volume to run it in, as well as other things like creating an actor with a spline component and so on.
If you don’t know any of that, start with this and then come back.
Procedural Content Generation
PCG stands for Procedural Content Generation, and it’s important to note that this is not the same thing as generative artificial intelligence. With generative AI you get a neural network to chew over StackOverflow for six months in the hope that you can fire half your workforce, or ask MidJourney to rip off DeviantArt so you can sell the miserable results as “concept art” on Fab.com.

By contrast, with procedural generation, you’re creating a procedure - a set of rules, an algorithm - and feeding it some input. The rules transform the input, and generate an output. (The word content is either vestigial or killer copy depending on whether you’re on the marketing team or not). More often than not there is also a big component of constrained randomness to it- you want the same inputs to produce the same outputs each time, but- usually- having a big range of variance in output from a small range of variance in input is considered a good quality.
On a macro scale you could argue that there’s not a great deal of difference between generative AI and rule-based generation, but if you zoom out to that distance you can also claim that Microsoft Excel is a tool for cataloguing smoothie recipes. In terms of implementation there’s a massive difference, not least because procedural generation can be done on virtually any computer, but anything to do with AI these days requires data centre, a spare £1bn, and a total disregard for your fellow man.
Some examples of procedural generation:
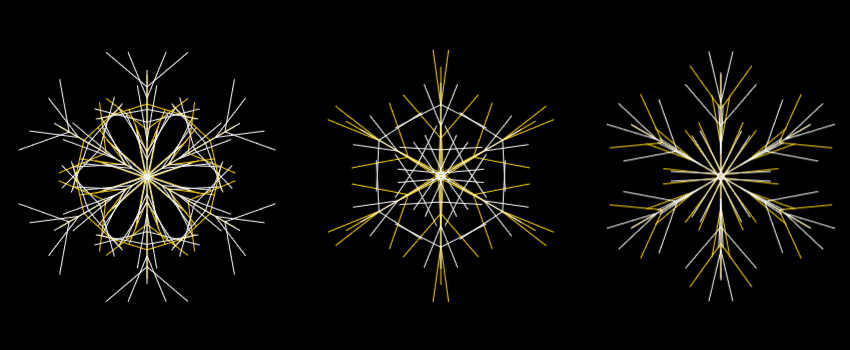
- A few years ago I made some Christmas cards by randomly generating snowflakes in JavaScript and then feeding the resulting SVGs into my pen plotter. Everyone got a different Christmas card, but I only had to write the code once. Have a play in the browser here.
When I made the April Fools joke/cry of despair that was brexfest.eu, the horrible noise that creeps on you as you scroll down is generated procedurally in real-time using the Web Audio API. It’s supposed to sound like the national conversation in Britain at the time, and I think it’s right on the money.
Most of the screensavers in the Jean-Paul Software Screen Explosion (which you should definitely buy) have some level of randomness driving them to keep things interesting over time.
And more historical examples- Conway’s Game of Life, Perlin Noise, not to mention any card game you can think of.
All these things use randomness and a set of rules to produce a result, and that’s also what Unreal’s PCG does.
But Unreal’s PCG isn’t an all-in-one procedural generation thing. It doesn’t produce audio, it can’t write words; it doesn’t make textures or meshes on its own either, although there’s some really fantastic interop with the bits that do.
What it does do, and does really well, is handle the placement of ‘stuff’ in an Unreal level according to rules that you create using the PCG graph. And despite the impression that you might get from YouTube tutorials and the official documentation say, this stuff doesn’t have to be trees
PCG is not a forest tool (but it is really good at forests)

There’s definitely too many trees associated with PCG, and we’ll get past that soon. But it is worth considering what you would need to do if you wanted to create a virtual forest.
Trees don’t float, they’re always on the ground, so you’d need to be able to work out where the ground was. Trees aren’t placed neatly in a grid, they’re spread around randomly- so you’d need some way of generating a set of random positions. And trees aren’t all the same size, so you’d want to be able to have a lot of variety of size and shape and orientation.
So, you need a data structure that can capture all that, and potentially more. In UE5 PCG that structure is called a point, and that’s the main thing you’ll be playing with in PCG. The most important properties it has are these:
- A Transform- your standard Unreal transform property, saying where something is and how it’s oriented
- Bounds- how big the point is. Points are usually represented by an oriented box, though there are options to treat them as a sphere instead. There’s two vector properties - BoundsMin and BoundsMax - that indicate where this box starts and finishes.
- Density and Steepness - single number values representing how ‘there’ the point is. Density can be thought of as a score or weight, and ‘steepness’ the fall-off rate of a radial gradient. Steepness is used by some nodes in conjunction with the bounds, for things like intersection tests between points. Both Density and Steepness are in the range of 0 - 1, but only steepness is actually locked to that.
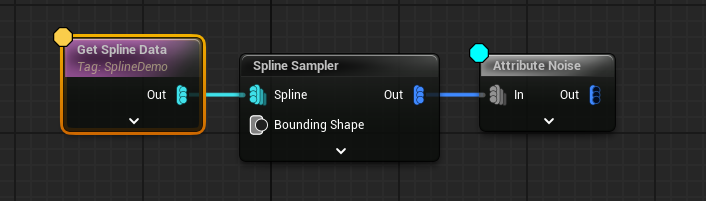
So how do we place these points? Well, there’s two ways- you can either create them directly, or you can sample them from things in the world- splines, the landscape, other points, actors, components. So let’s do that.
Here I’ve got a spline, and I’m sampling points on the interior of it.
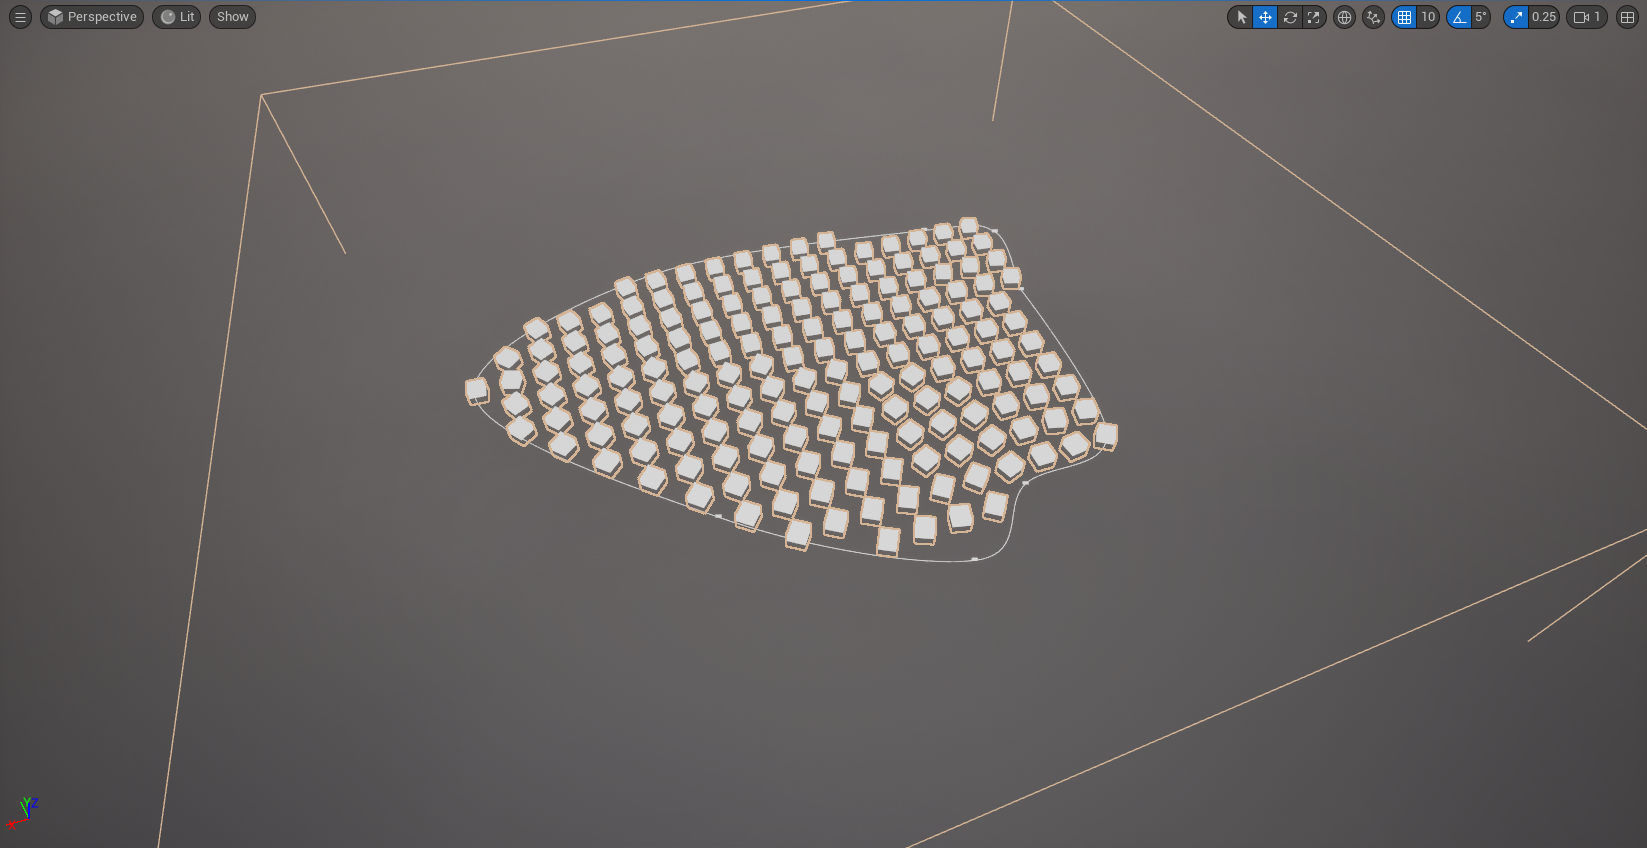
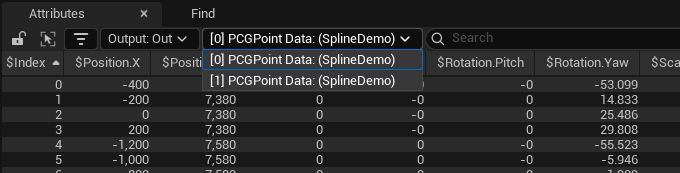
Before we turn them into trees, let’s inspect the output in the spreadsheet view:
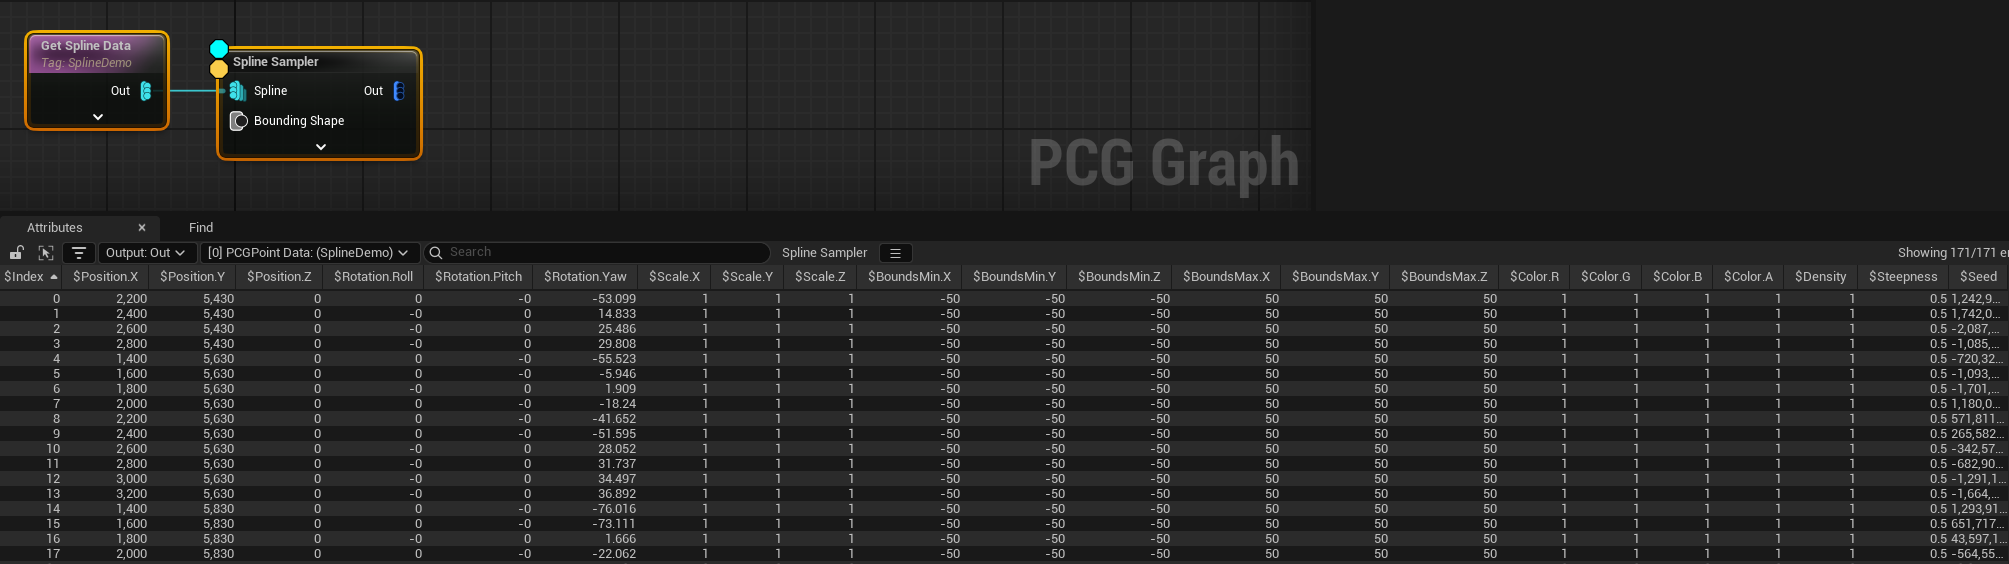
So far, so good- we can see the points, and we can see what values have been given to their different properties.
But! There’s a couple of non-obvious things here that are really important!
![Attributes? [0] PCGPointData? $Position.X? (SplineDemo)?](/images/posts/PCGBlog/spreadsheet.png)
- The title of this view is not spreadsheet, it’s
Attributes. - Each variable you can see is prefixed with a
$. - There is property there called
$Seed, which doesn’t seem to have anything at all to do with the other numbers. - There’s box with
[0] PCGPointData (SplineDemo)written in it.
Let’s go through these:
- Attributes are variables that include both the properties of the points themselves, and metadata that you can freely create and manipulate. Metadata doesn’t have to be connected to a point at all- it exists on its own- but each point has a hidden
MetadataEntryfield that allows it to be tied to specific attribute values. There are also some computed properties that are read-only; more on those in a bit.
The nodes in PCG rarely make any distinction between point properties and metadata- you can manipulate them both in largely the same way, and they’re always referred to as ‘attributes’. But there is a small indication that something is a property rather than metadata, which is…
- …the
$prefix. If an attribute has that, it’s a property rather than a metadata attribute. It should also be mentioned that this view is also doing a bit of data massaging for us- we can see$Positionand$Rotationand$Scale… but no$Transform. However if we look at how aPointis defined in C++, we get this:
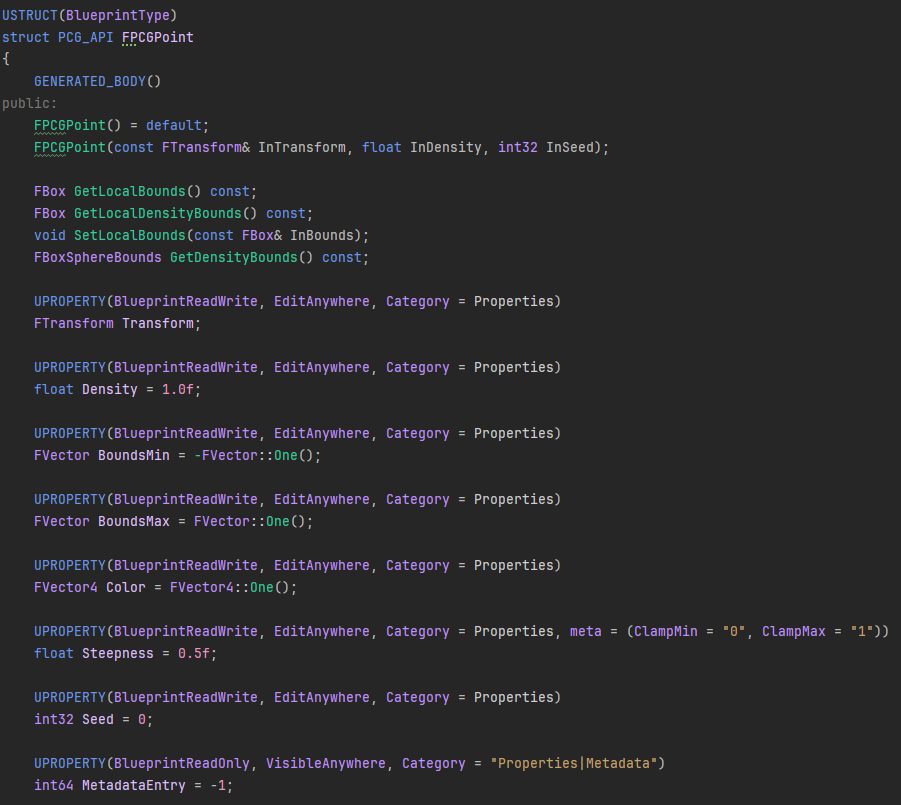
$Position and $Rotation and $Scale are being extracted from the transform and displayed separately. But when you’re doing operations on these, you can address them in the same way- there’s no need to type $Transform.Position.X, you can just use $Position.X. The same goes for $Rotation, except there we can also access the local components of the transform with $Rotation.Forward, $Rotation.Up and Rotation.Right and so on. These are computed properties, not ones we’re storing, but for most purposes we can treat them as if they are just regular attributes.
$Seedis something we’re going to use whenever we want to do something random. Recall that previously I mentioned the idea of constrained randomness; it is important to remember that we’re using this for creating game worlds, and we want anything we generate to look the same each time we visit it. This means that we can’t completely randomise properties- they have to have some marker that will allow us to place them in the same way each time, but perceptually they should still with all the properties of a fully random draw.
Nearly all random operations in computing are in fact pseudo-random operations- mathematical functions that have very unpredictable output for any given input, but if given the same input will always produce the same result. The $Seed property is that input. It allows random-seeming behaviour whilst giving fully deterministic results.
[0] PCGPointData (SplineDemo)tells us a whole lot of very important things:- Points don’t exist on their own! They’re inside a data collection which itself can have a number of properties.
- The
[0]indicates that this is the first in the list of collections that our node has produced.PCGPoint Dataindicates that this is a collection of typeUPCGPointData, and so a collection containing points. There are other types of collection for the other types of object that you can manipulate- attributes, splines, and so on. SplineDemois a tag. Tags are everywhere in Unreal now, and PCG is no exception. Tags are short strings of text that can be used as an identifier. Tags in PCG are attached to data collections. This collection has the tag ‘SplineDemo’ because that was the tag I put on the actor that contained the spline.
Tags are incredibly useful- some get generated automatically, but for the most part you add them yourself, and they allow you to categorise and filter data much more cheaply than filters that operate on attributes.
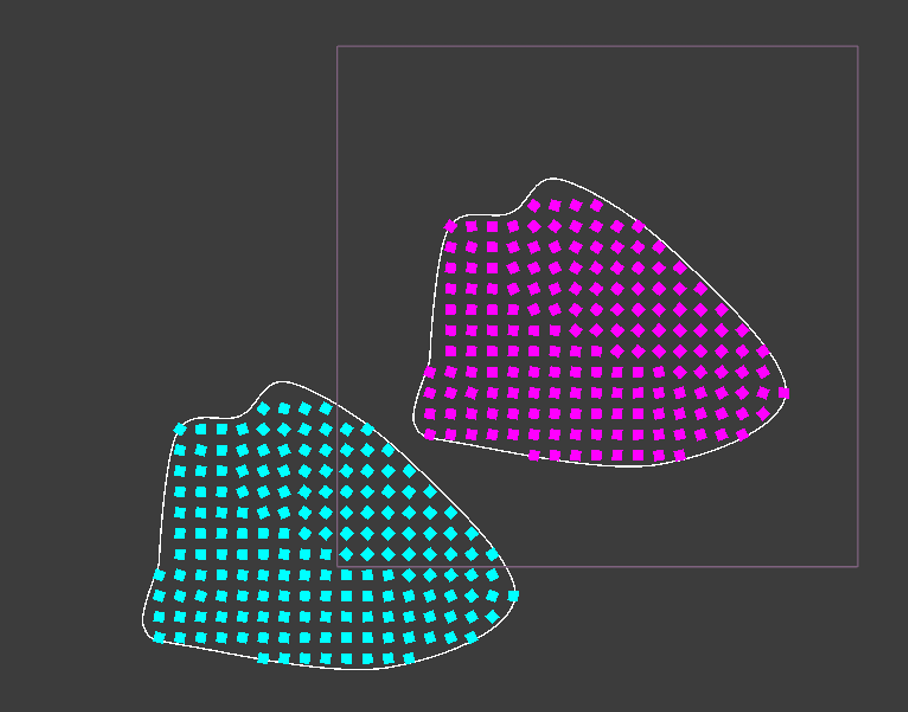
Let’s add a second spline and inspect the result:
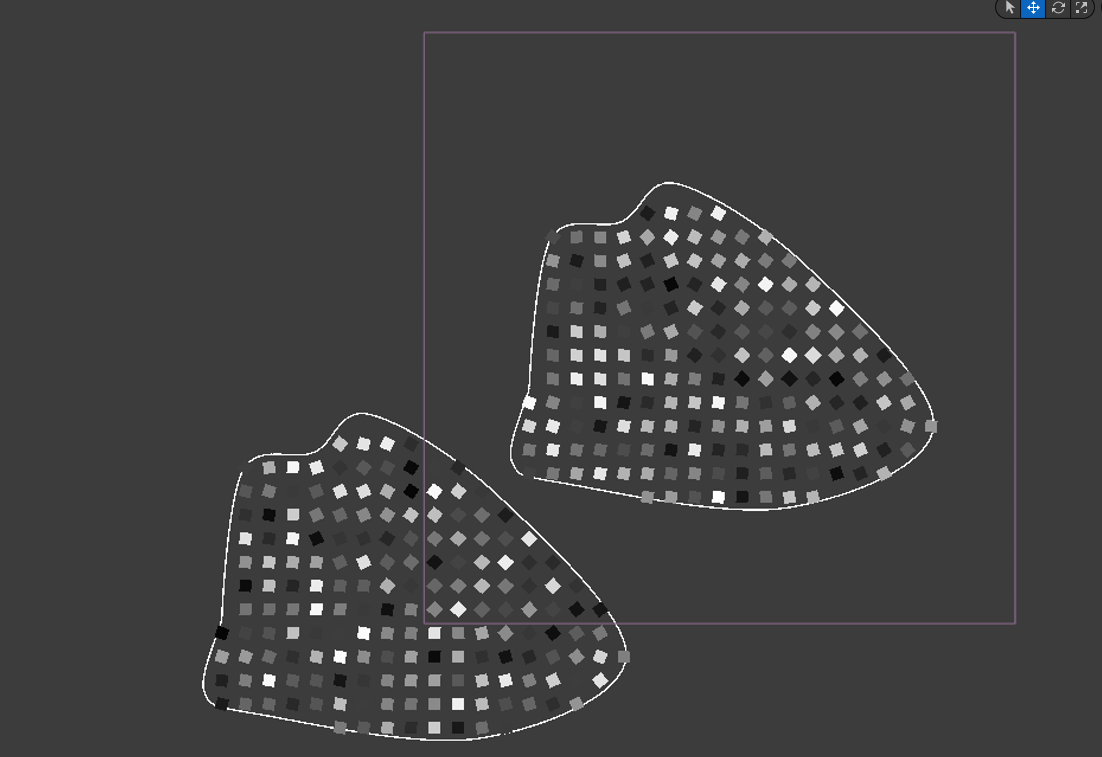
If you’re wondering why they’re now different colours, that’s because I’ve used an Attribute Noise node to modify the density of the different points according to their seed.
As you can see, although the splines are the same shape, and one is just copied and pasted from the other, the points within have different density values. Why? Well if I’d used the Spatial Noise node it would be because they’re in different places, but here it’s because they’ve got different $Seed values. That’s pseudo-randomness in action.
Some more on attributes
To demonstrate all of the above, here’s the Load Data Table node. It’s got two options for output- either you can output just the attributes, or you can output a set of points with the attributes attached to them. If we pick the latter, we get this:
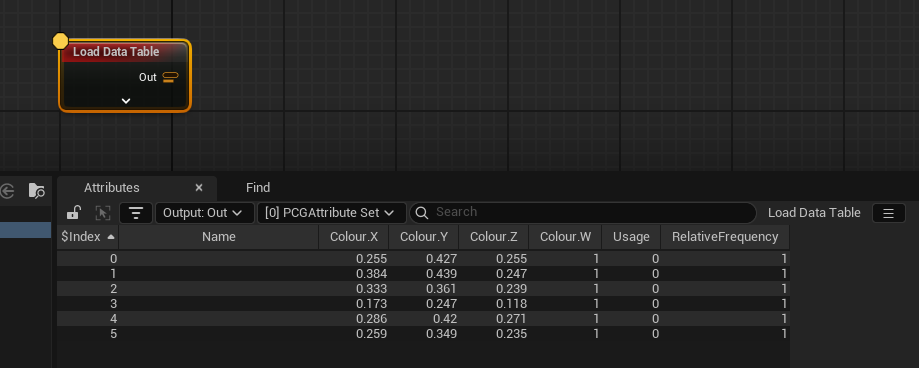
- As you can see, nothing has a
$attached to it, except the$Indexfield.$Indexis another computed property, and is the position of the corresponding element in the collection. - The type has changed to
PCGAttribute Set, so we’re dealing with a collection of metadata rather than a collection of points. - There’s no tags- before we had
SplineDemoin brackets, here we don’t. - The output icon on the node is a sort of stacked orange USB-C port, indicating metadata, whereas before we had blue dots, which indicate points
If we pick the other option for this node, and load the data table as points, we get this:
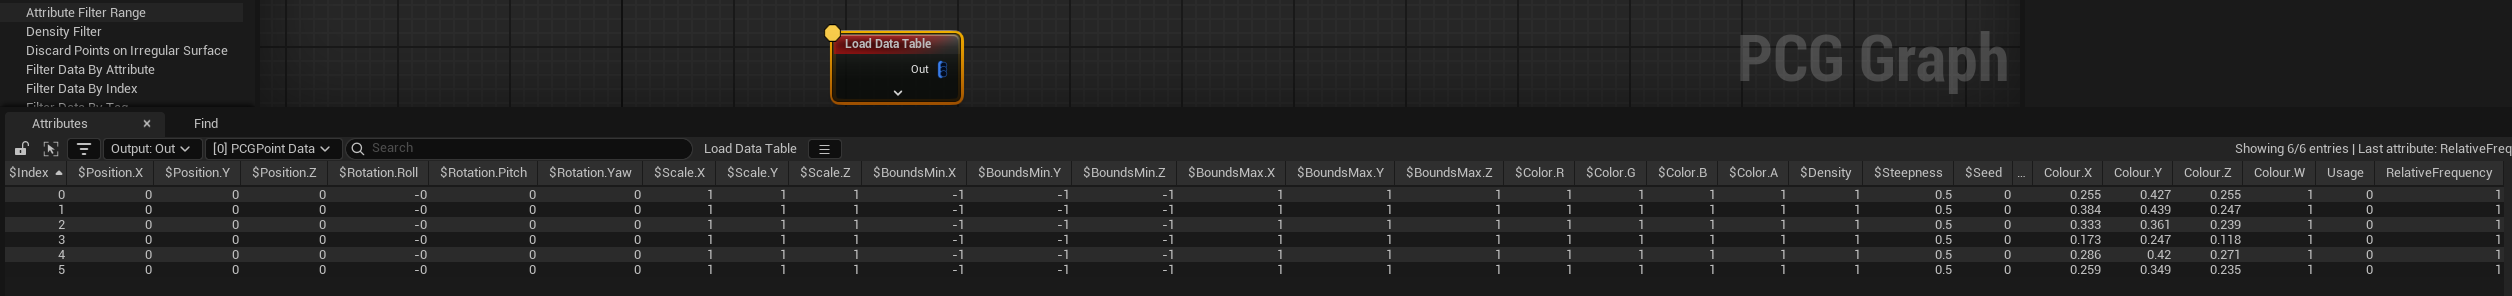
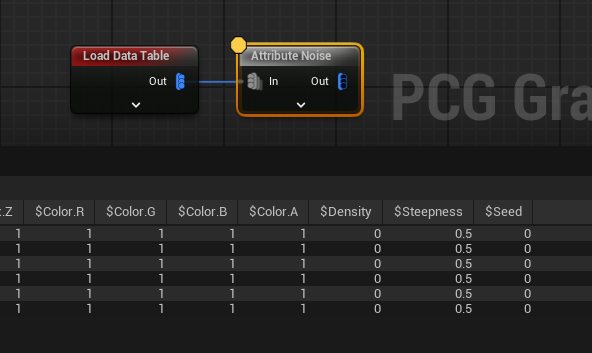
APoints, with the attributes assigned, but with default values for everything else- including the seed. The seed usually gets computed when a point is created or copied, usually from the position it has. But these points are all at the same position, so even if the seed had been computed, they’d all get the same seed. If we do the Attribute Noise we did before with this, we’ll get the same output for the $Density field of each.
Start thinking in collections
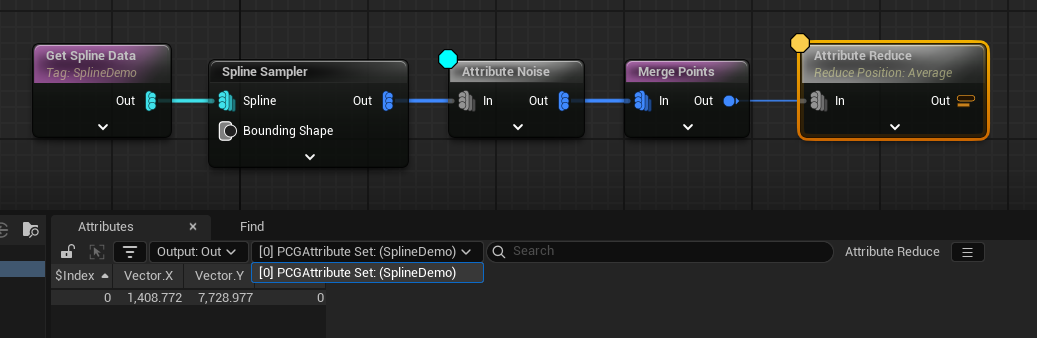
Whilst they’re not exactly glam to think about, collections are extremely important. Most PCG operations are done on the contents of a collection, but it is collections themselves that are passed between the different nodes. As an example, let’s get the average position of the points we’ve just made.
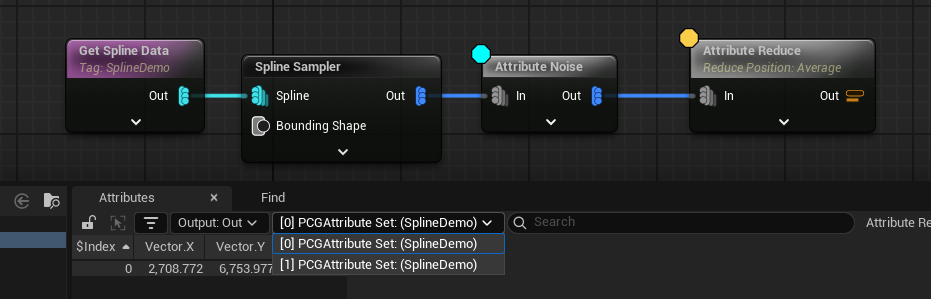
The Attribute Reduce node iterates over the data within a collection and computes a value - here I’ve used the Average operation on the $Position property, but there’s also Min and Max and so forth.
But we don’t get the average position of all the points, we get the average position of the points within each collection, with a separate PCGAttribute Set collection being output for each. If we wanted to get the average of all the points in this way, we need to merge them into a single collection first, like this:
…and that gives us one value rather than two. The icons on the nodes hint at this behaviour. If you look at the Merge Points node in the screenshot above, you’ll see there’s three blue dots on the left, and one on the right- that indicates whether the input or output is multiple collections, or a single collection.
Always looping, all the time
This brings us to another thing to know about, which is how data gets processed. The PCG framework is designed to be able to shunt around a lot of data, and pretty much expects that it’s going to be used in that way. It’s very heavily multi-threaded, so processing a few thousand points has a similar perceived performance cost to processing twenty.
So, you don’t need to worry about the individual points. Nearly every node you see is some sort of loop- points and attributes given as input will all be batch processed within the collection they’re in, and in fact you have to do extra work when you want that not to happen.
They’ll also loop over the collections as well- no need to specifically separate them out. But that itself can lead to some problems.
A (rather synthetic) example- there’s a node called Match and Set Attributes that either randomly assigns attributes from one input to another, or looks for a ‘match’ attribute, and copies it over the other attributes when it finds it.
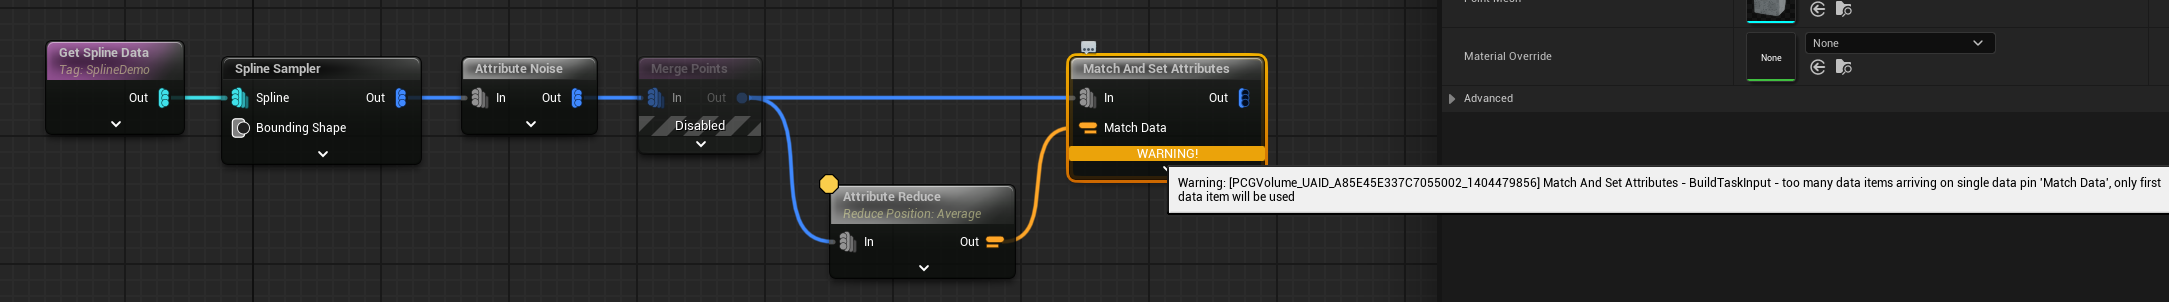
Let’s say we want to record the average position of each collection to the points themselves as an attribute so we can calculate how far away they are from their centroids. Turns out, we can’t do that with Match and Set- we get a warning, because that node expects a single collection of attributes on the ‘Match Data’ pin. Recall that the Attribute Reduce node gave us a different average for each collection, and so also gave us two collections.
How do we resolve this?
We can’t merge the attribute sets, because that would mean we’d get a random pick of the two possible values recorded next to each point. And we don’t want to merge the points, because then we’d lose the separation we’re trying to have.
(I should point out that the actual answer is “use the Copy Attributes node because that’s actually designed to do this”, but this type of problem does crop up quite a lot, and it’s the most basic example I can come up with, so just run with it for now)
In situations like this we need a Loop node so we can separate them out. The Loop node takes another PCG graph that you specify, and passes collections to it one at a time, rather than all at once. Each pin you specify as being a ‘loop’ pin needs to have the same number of collections passed to it, but assuming that’s true, you can now process them each in isolation from the others.
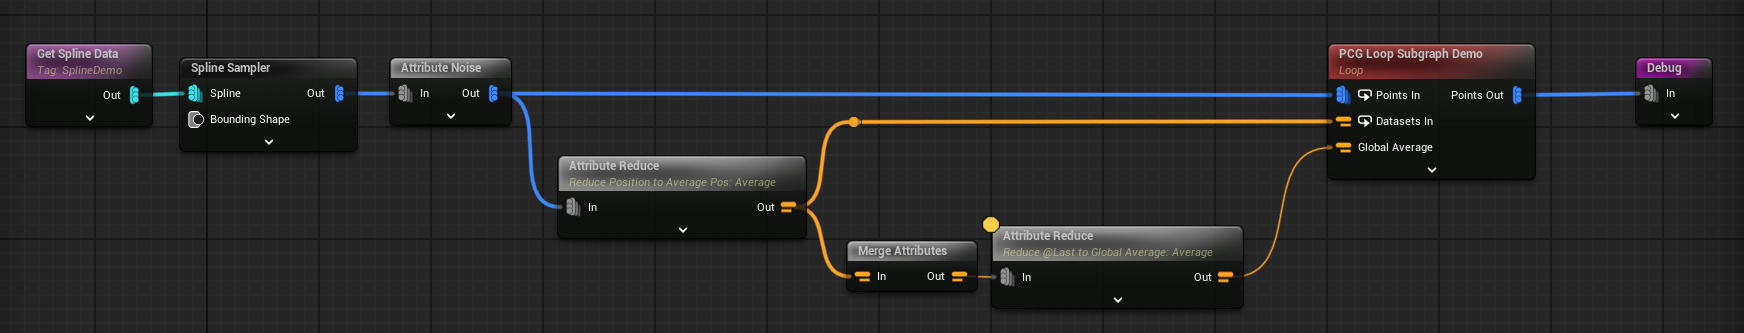
Here I’m also getting the average position of the average positions, so we can compare the collection as a whole against the middle of all the collections.
In the loop, we’re able to use our ‘match and set’ correctly, because we’ve now only got one set of match data at a time.
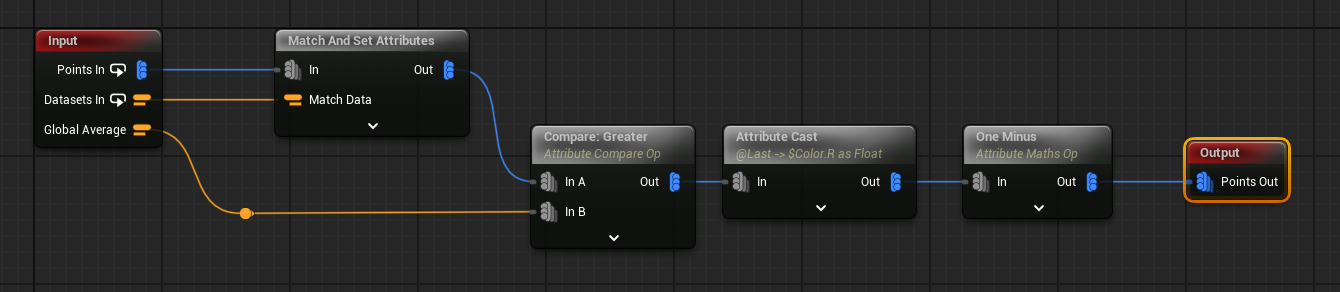
For fun, I’m also modifying the $Color property (note the horrible US spelling) by using a Compare node to check the average position for the collection against the global average. This produces a boolean result, so I cast that to a float, and output the result of that to the Red channel of $Color. I then set the Green channel to 1.0 - Red.
Which gives us this:
That’s it for now
All this is just scratching the surface of PCG, but it’s the stuff I felt most important to get written down somewhere. There’s other things I could go into- other things you can manipulate apart from points and attributes, how splines are look like points but are at the same time not at all like points, what ‘spatial data’ and ‘concrete data’ are and so on- but I’ll try and cover those in future posts as they pop up.
In the next post, whenever that is, I’ll go into some of the detail why I started using the amazing PCGEx plugin, and how it opens up all sorts of options for non-forest settings. So less of this…
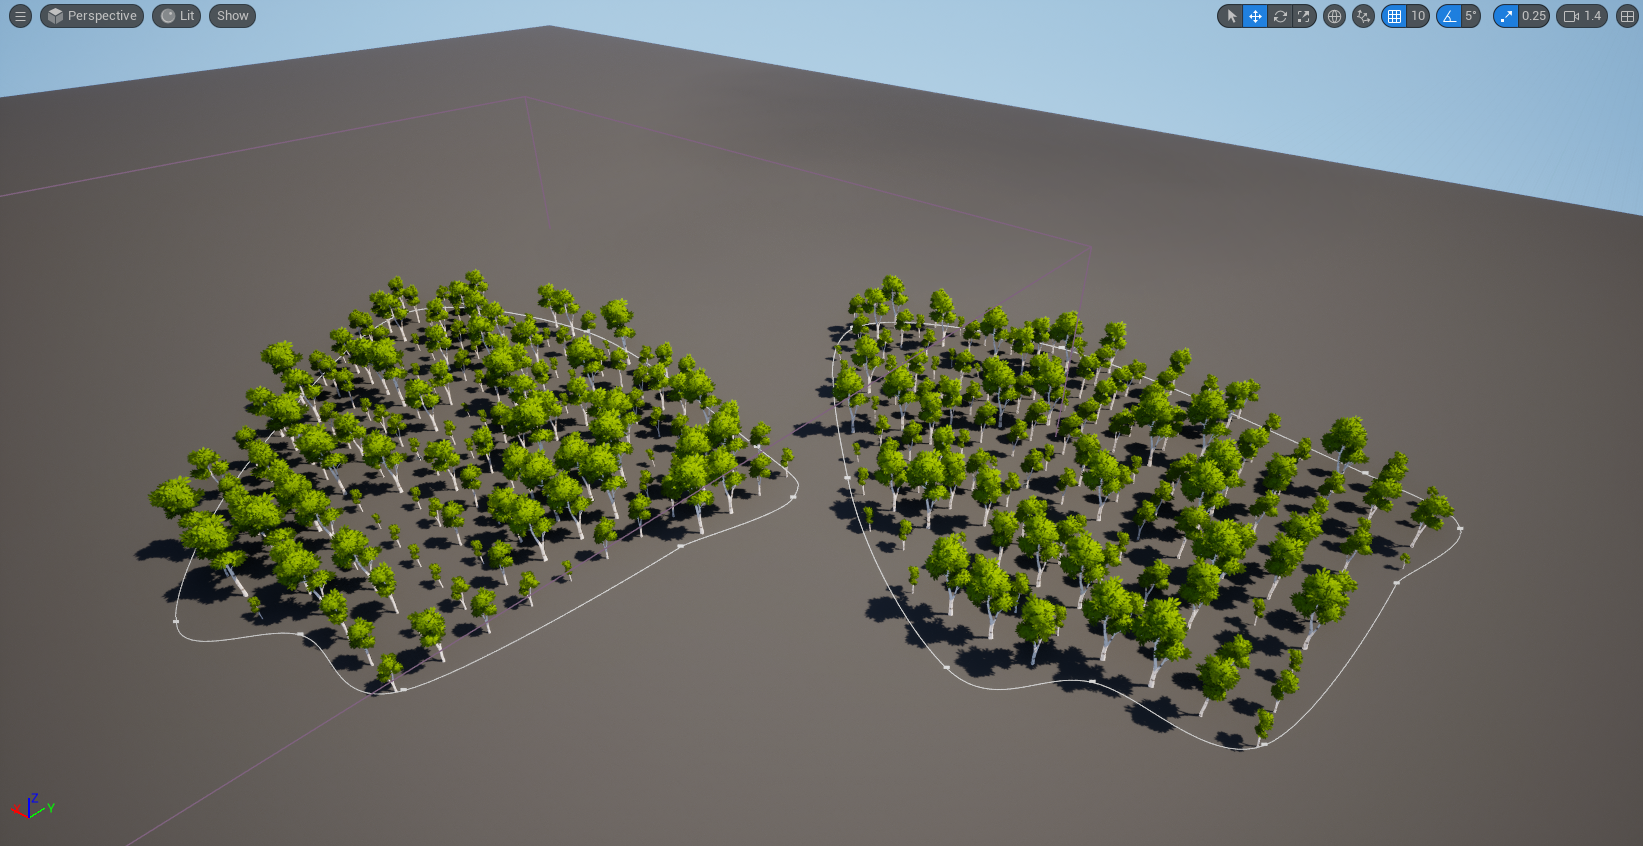
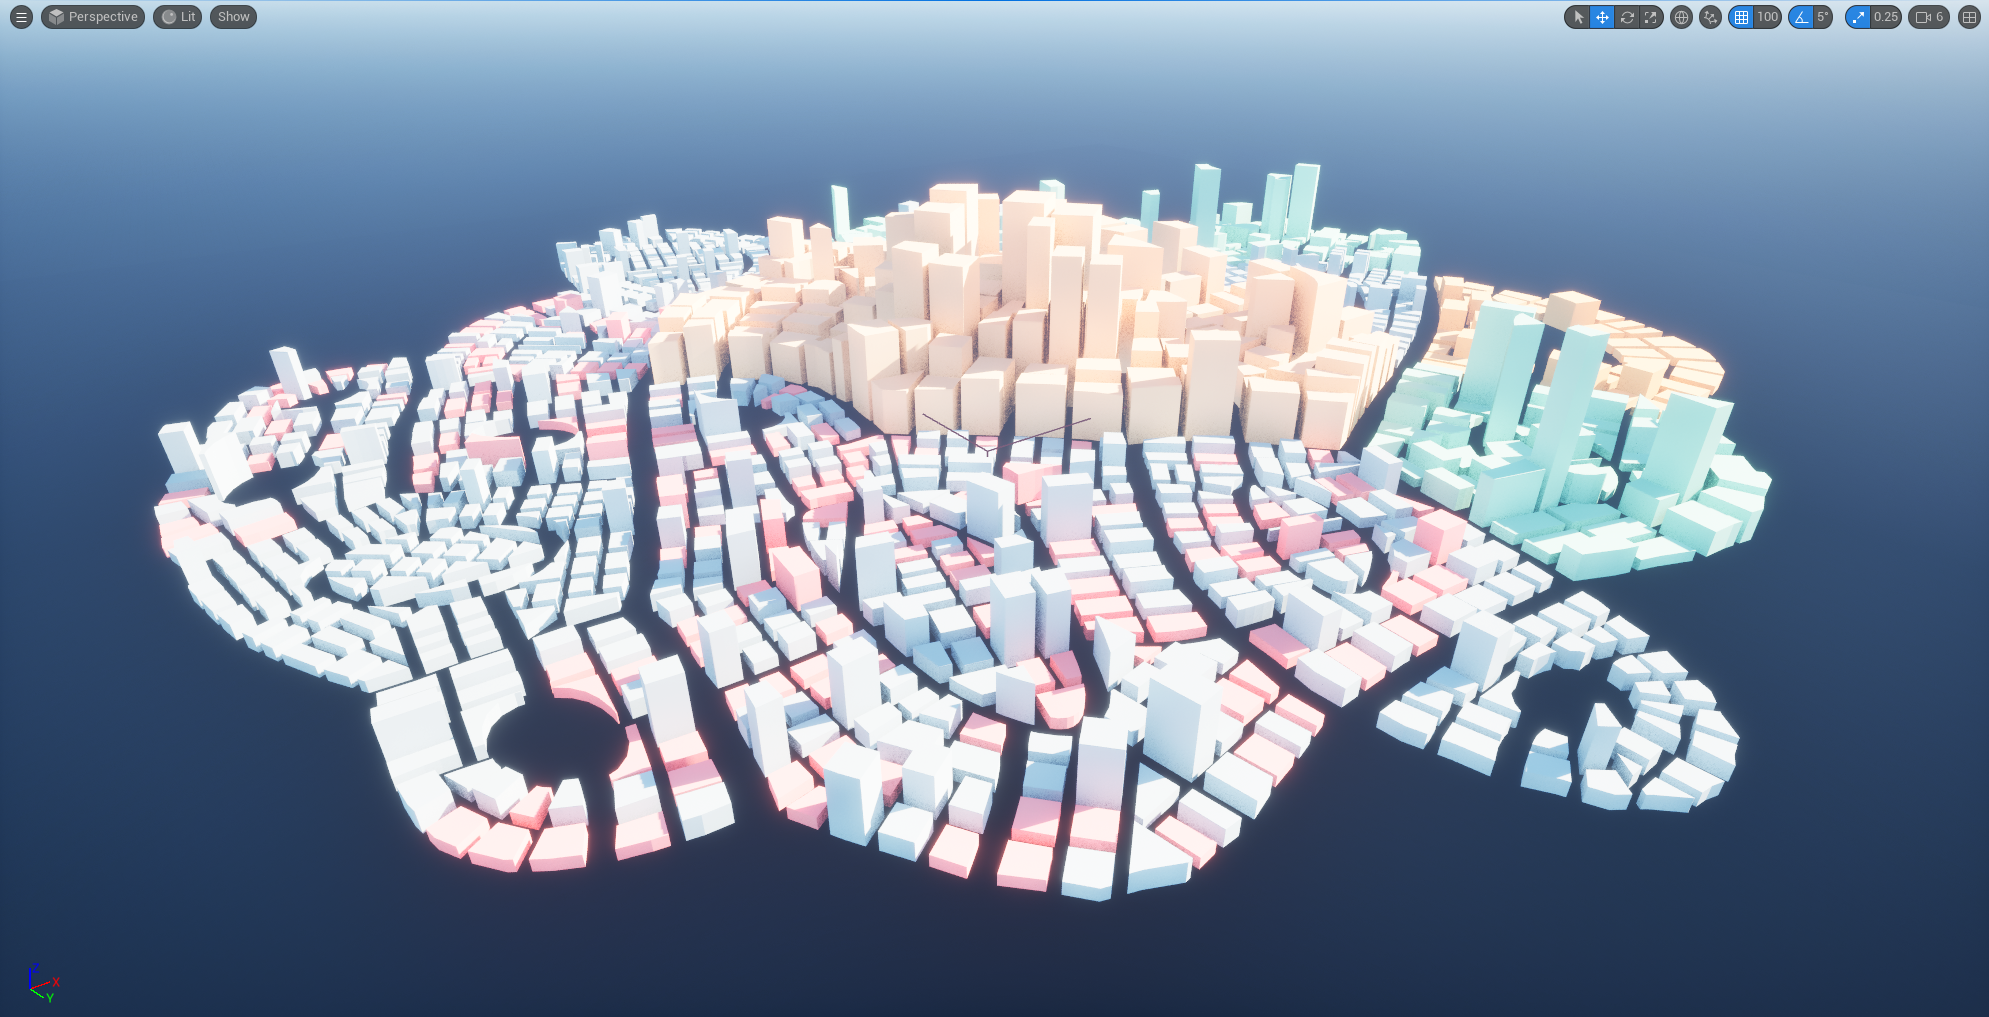
… and more of this:
I’m also on Bluesky now- give me a follow here for more updates on what I’m actually working on, and do let me know if you found this helpful.
Big thanks to Tim and Mike on the PCGEx Discord for proof-reading and corrections! Tim also suggested some sort of joke about ‘forests’ and ‘seeds’- please feel free to fill that in for yourself